What is happening to Average Position!?!?!?!
Today is a sad day for us PPC marketers. According to Google, as of today, they are going to ‘sunset’ Average Position as a metric. Average Position has always been a metric that we use to get a strong indication of how our paid ads are positioned in relation to our competition on the SERPs and have helped to determine how to adjust bidding strategies to become either more or less aggressive in a particular auction, so why remove it!?
Google plans to replace it with 2 new metrics, which they say will provide a clearer view of where ads actually appear in the SERPs.
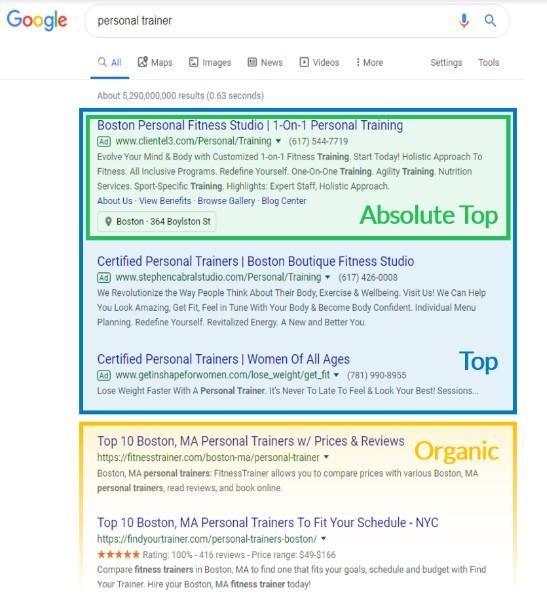
Impressions (Top) % - This refers to any impressions received above the organic listings and the number of positions this includes will vary auction-to-auction depending on numerous variables.
Impressions (Absolute Top) % - This refers to any impressions receiving in position 1 at the top of the listings.
Do these metrics adequately replace average position and provide enough additional insight to assist in our ability to optimise campaigns based on the position of our ads on the SERPs? We think not.
Google has effectively reduced the average position metric to 3 positions, whereas it used to be 7+, so that to us seems to be less transparent than it has always been.
One argument here is that the number of ads on a page can vary, which means that average position didn’t accurately report on exactly where an ad was appearing on a page (above or below organic), however what average position did give a better measure of was how were you positioned compared to your competitors.
The Impressions (Absolute Top) % metric is clearly defined and will be a useful to determine the percentage of times you are guaranteed to be above your competitors, but the Impressions (Top) % metric is altogether too vague.
Where a SERP has 4 results on a page this one metric now covers 3 positions with no possible way to determine whether you are P2 or P4, except to blindly assume that a higher percentage most likely means you are higher up the page.
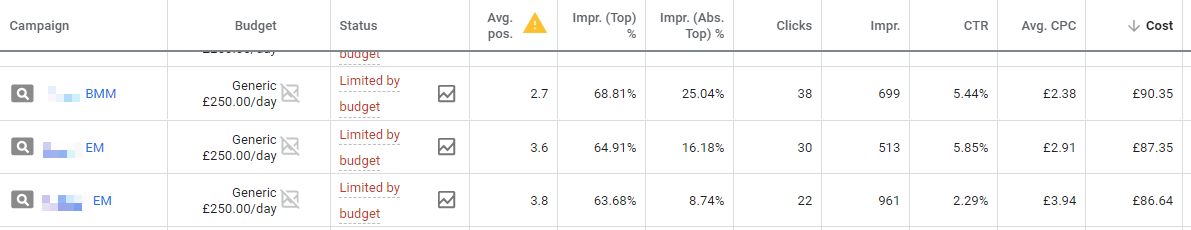
As you can see in the example below based on Google’s replacement metrics the 3 campaigns below have a very similar Impressions (Top) %, separated by less than 5% variable, but there is a whole position variable on the SERPs according to average position.
Now that Average Position is ‘sunsetted’, how are we as marketers going to understand these nuances in the top 4 positions? Or are Google suggesting that this metric we have all used for so many years is misleading and not accurate.
It would make sense to add these new metrics as a way to support the existing metric to assist in our abilities to optimise campaigns effectively, but instead Google encouraging people to bid more aggressively in order to achieve more costly impressions and clicks above organic in a subtle move to boost revenue through the paid listings on the SERPs.
It is an easy assumption to make that if your Impressions (Top) % is below 50% that on average your ad is appearing more frequently below the organic results than above them. Beyond that as rule of thumb, we are frequently seeing 60%-70% to be the equivalent of P3-4, 70%-80% P2-3, 80%-90% P1-2 based on comparisons of the new metrics with the old, however, there are cases that don’t support this (as previously highlighted).


